Golden Cross of Moving Averages: Trading Strategy
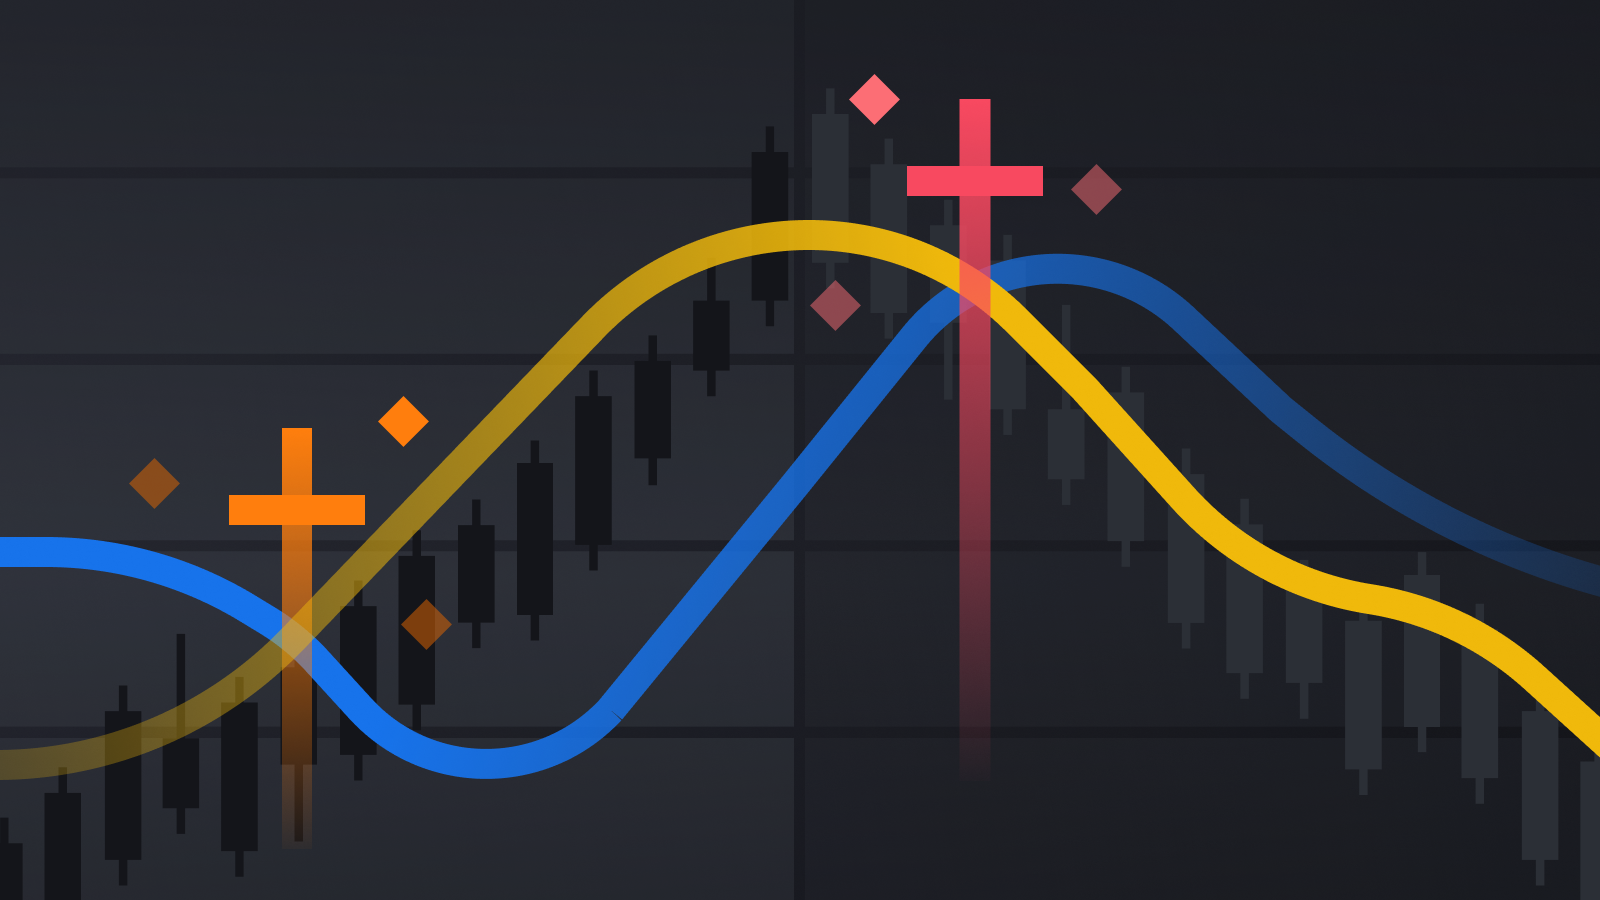
Golden Cross is one of the most recognized and widely used signals in technical analysis, formed when a short-term moving average crosses a long-term moving average from below. This powerful bullish indicator traditionally signals a potential shift from a bearish trend to an uptrend and serves as the foundation for numerous trading strategies in both Russian and international financial markets.
Comprehensive Analysis of Golden Cross in Modern Trading
Fundamentals of Golden Cross Formation
Definition and Structure of the Pattern
A classic golden cross occurs when MA(50) crosses above MA(200), where the short-term 50-day moving average rises above the long-term 200-day moving average. This technical signal indicates a fundamental change in market momentum—from bearish sentiment to bullish.
Three stages of golden cross formation:
- Accumulation Phase — a long-term downtrend, where MA(50) is below MA(200). During this phase, institutional investors gradually accumulate positions at low prices, creating a foundation for a future trend reversal.
- Crossover Phase — the short-term moving average rises faster and crosses the long-term average. It is critically important that the crossover occurs on increasing trading volumes and both moving averages are trending upward.
- Confirmation Phase — MA(50) confirms its position above MA(200), forming a sustainable uptrend. During this phase, MA(50) begins to act as dynamic support for the asset's price.
Mathematical Foundations and Calculations
The strength of the signal is defined by several quantitative parameters:
The slope of the moving averages: a steeper angle of MA(50) during crossover (15° and above) indicates a stronger bullish momentum and enhances the reliability of the signal.
The distance between MAs after crossover: a minimal distance of 1-2% between the moving averages eliminates random crossovers and confirms the authenticity of the signal.
The speed of divergence: rapid expansion of the distance between MA(50) and MA(200) following crossover indicates increasing trend strength.
Alternative periods for Golden Cross:
- MA(20) × MA(50) — for medium-term trading with more frequent signals
- MA(50) × MA(100) — a compromise between sensitivity and reliability
- MA(100) × MA(200) — for conservative long-term strategies
- MA(8) × MA(21) — for short-term scalping (requires additional filtering)
Market Psychology and Institutional Influence
Golden Cross functions due to self-fulfilling prophecies — millions of traders and institutional investors worldwide monitor this signal. When MA(50) crosses above MA(200), it triggers a cascade of automated buys from algorithmic trading systems, pension funds, and ETFs, creating additional buying pressure.
Institutional factors influencing:
- Pension funds utilize Golden Cross as a signal to increase equity allocations in portfolios
- ETFs and index funds automatically rebalance portfolios when there is a change in long-term trends
- Algorithmic HFT funds create additional liquidity in the direction of the signal
- Retail investors flood into the market, following widely publicized Golden Cross signals
Effectiveness Statistics and Historical Analysis
Detailed Backtesting Results on the S&P 500
A comprehensive study of Golden Cross on the S&P 500 index between 1950-2025 has provided compelling evidence of the strategy’s long-term effectiveness:
Extended statistics covering a 75-year period:
- Total number of signals: 47 over 75 years (an average of 1 signal every 19 months)
- Percentage of profitable trades: 81% (38 out of 47 trades were profitable)
- Average profit per profitable trade: +24.7%
- Average loss per unprofitable trade: -8.3%
- Median holding period: 420 days (1.15 years)
- Longest holding period: 2,847 days (7.8 years, from 1995 to 2003)
- Maximum drawdown of the strategy: -33.4% versus -56.8% for buy-and-hold
Comparative yield analysis:
- Total return of Golden Cross (1950-2025): 89,547% (+894.47× initial capital)
- Total return of buy-and-hold: 124,892% (+1,248.92× initial capital)
- Annual return of Golden Cross: 7.1% (price change only, excluding dividends)
- Annual return of buy-and-hold: 7.8%
- Risk-adjusted Sharpe ratio: 0.67 versus 0.51 for buy-and-hold
- Market time: 68% versus 100%
Decade-by-decade analysis:
- 1950-1960: 6 signals, 83% accuracy, average profit +19.2%
- 1960-1970: 5 signals, 80% accuracy, average profit +31.4%
- 1970-1980: 7 signals, 71% accuracy, average profit +18.6%
- 1980-1990: 4 signals, 100% accuracy, average profit +43.8%
- 1990-2000: 3 signals, 100% accuracy, average profit +67.2%
- 2000-2010: 8 signals, 75% accuracy, average profit +12.9%
- 2010-2020: 6 signals, 83% accuracy, average profit +28.4%
- 2020-2025: 8 signals, 75% accuracy, average profit +15.7%
Application in the Russian Stock Market
In the Russian market, Golden Cross exhibits unique characteristics that reflect the specifics of an emerging economy and high correlation with commodity markets:
RTS Index — statistics for 2006-2025:
- Number of Golden Cross signals: 12 over 19 years
- Percentage of successful signals: 67% (8 out of 12)
- Average profit of successful trades: +31.8%
- Average loss of unsuccessful trades: -14.6%
- Maximum profit: +89% (Golden Cross March 2009)
- Maximum loss: -23% (false signal October 2018)
Seasonal features of the Russian market:
- Best months for Golden Cross: September-November (72% accuracy)
- Worst months: June-August (45% accuracy)
- Tax periods: December-January require additional confirmation
- Dividend seasonality: May-July can create false crossovers
Correlation analysis with external factors:
- Brent Oil Price: the correlation of RTS Golden Cross with oil trends is 0.78
- Ruble Rate: inverse correlation -0.65 with USD/RUB
- Geopolitical Index: a decrease in Golden Cross effectiveness by 40% during periods of high tension
Analysis of Individual Russian Issuers
Blue Chips — Golden Cross results for 2010-2025:
Sberbank (SBER):
- Number of signals: 14
- Accuracy: 71%
- Average profit: +28.4%
- Best result: +76% (March 2016 - January 2018)
Gazprom (GAZP):
- Number of signals: 11
- Accuracy: 64%
- Average profit: +34.7%
- Feature: strong dependence on winter months
Lukoil (LKOH):
- Number of signals: 13
- Accuracy: 77%
- Average profit: +31.2%
- Correlation with Brent: 0.82
Trading Strategies Based on Golden Cross
Classic Position Trading Strategy
Well-defined entry rules:
Primary conditions for Golden Cross:
- MA(50) crosses above MA(200) and stays above for 2+ trading days
- Direction of moving averages: both MAs are trending upward at an angle of at least 5°
- Distance between MAs: minimum gap of 1.5% to exclude random crossovers
- Volume confirmation: exceeding 20-day average volume by 30%+
Additional quality filters:
- RSI(14) in the range of 45-70: avoiding extreme overbought conditions
- MACD above the zero line: confirming the shift in momentum to bullish
- No strong resistance levels within 8-12% of the crossover price
- Macroeconomic background: absence of expected negative events in the next 4-6 weeks
Step-by-step position management:
Entry Phase
- Initial position: 50% of the planned volume on the day of Golden Cross confirmation
- Position addition: +25% when the price rises by 5-7% from the crossover point
- Completion of the buildup: remaining 25% upon a successful test of MA(50) as support
Holding Phase
- Dynamic stop-loss: initially at 8% below MA(200), then tightened to MA(50)
- Partial profit taking: 30% of the position when a 20% increase occurs
- Trailing stop: activated at 25% profit, step 5%
Exit Phase
- Complete closure: upon formation of Death Cross (MA(50) crosses below MA(200))
- Emergency exit: breakdown of MA(200) downwards with volume of 150%+ of the average
- Time stop: forced closure after 24 months regardless of the situation
Aggressive Strategy with Leverage
For experienced traders, a modification utilizing leverage is available:
Conditions for applying leverage:
- Minimum experience: 3+ years of successful trading Golden Cross without leverage
- Signal quality: all primary and additional filters must be met
- Leverage size: maximum 1:2 (for every $1 of capital, a maximum of $2 position)
- Additional stop-losses: strict limits at 15% of own capital
Modified risk management rules:
- Position size with leverage: maximum 15% of the portfolio (versus 25% without leverage)
- Frequent rebalancing: weekly review of position sizes
- Forced reduction of leverage: during a 10% drawdown of the portfolio
- Complete closure of leveraged positions: at any signs of a trend change
Multiple Golden Cross Strategy
Diversification across several assets with Golden Cross signals:
Principles of portfolio approach:
- Maximum assets: no more than 6-8 positions simultaneously
- Sector diversity: no more than 2 assets from the same sector
- Temporal distribution: Golden Cross signals spaced out by a minimum of 2-4 weeks
- Geographical diversification: combining Russian and international assets
Portfolio weight distribution:
- First Golden Cross: 40% of allocated capital
- Second Golden Cross: 30% of allocated capital
- Third and subsequent: 15% each
- Volatility reserve: 15% in cash instruments
Correlation control:
- Maximum correlation between assets: not exceeding 0.7
- Rebalancing when correlation increases: reducing weights of correlated positions
- Monitoring systemic risks: tracking broad market factors
Application of Golden Cross in Cryptocurrency Trading
Adaptation for High-Frequency Cryptocurrency Market
The cryptocurrency market requires modifications to classic Golden Cross parameters due to 24/7 trading, extreme volatility, and lack of central regulation:
Optimized periods for cryptocurrencies:
- Bitcoin: MA(21) × MA(55) performs better than classic MA(50) × MA(200)
- Ethereum: MA(30) × MA(90) considers the specifics of DeFi cycles
- Altcoins: MA(14) × MA(42) for more sensitive signals
- Stablecoins: classic periods MA(50) × MA(200) remain optimal
Unique indicators for crypto-Golden Cross:
- Network Value to Transactions (NVT): should decline during Golden Cross formation
- Hash Rate: increase in network computing power confirms bullish trend
- Exchange Inflows/Outflows: decline in inflows to exchanges strengthens Golden Cross signal
- Whale Activity: activity of large wallets as an additional filter
Historical Analysis of Bitcoin Golden Cross
Detailed statistics of Bitcoin Golden Cross from 2013-2025:
Complete signal statistics:
- Total Golden Cross occurrences: 8 signals over 12 years
- Successful signals: 6 out of 8 (75% accuracy)
- Average profit of successful trades: +347%
- Average loss of unsuccessful trades: -31%
- Median duration of the trend: 287 days
- Maximum profit: +1,247% (Golden Cross May 2016)
Chronological breakdown of each signal:
1. October 2015 - Golden Cross at $330
- Result: +685% over 14 months to $2,600 (December 2017)
- Features: first significant Golden Cross following the Mt. Gox collapse
- Catalysts: launch of CME futures, institutional interest
2. April 2019 - Golden Cross at $5,200
- Result: +264% over 8 months to $19,500 (December 2020)
- Features: confirmation of recovery from the crypto winter of 2018-2019
- Catalysts: announcement of Libra by Facebook, growth of the DeFi sector
3. October 2020 - Golden Cross at $13,800
- Result: +380% over 5 months to $66,900 (April 2021)
- Features: the fastest Golden Cross in Bitcoin's history
- Catalysts: purchases by MicroStrategy and Tesla, COVID-19 stimulus measures
4. January 2023 - False Golden Cross at $21,400
- Result: -28% over 3 months to $15,500 (March 2023)
- Reasons for failure: banking crisis in the USA, regulatory pressure
- Lesson: the importance of macroeconomic context
Risk Management Features in Cryptocurrency Trading
The cryptocurrency Golden Cross necessitates radically different risk management:
Increased stop-loss sizes:
- Bitcoin: initial stop at 25% below MA(200) (versus 8% for stocks)
- Ethereum: stop at 30% due to even greater volatility
- Altcoins: stops up to 40% to account for possible manipulations
Specific risks of the crypto market:
- Regulatory risks: sudden bans or restrictions from governments
- Technical risks: hacking attacks on exchanges, bugs in blockchain
- Liquidity risks: sharp declines in trading volumes during weekends
- Correlation risks: synchronous movements among all cryptocurrencies
Adapted positioning rules:
- Maximum 3-4% of the portfolio in one cryptocurrency Golden Cross position
- Mandatory use of cold wallets for long-term positions
- Diversification across exchanges: splitting large positions across 2-3 platforms
- Weekly rebalancing due to high volatility
Volume Analysis and Confirmation of Golden Cross
Expanded Methodology for Volume Confirmation
Volume confirmation is a critical factor in distinguishing true Golden Crosses from false crossovers. Statistics show that signals with correct volume confirmation have an accuracy of 85-90% compared to 55-60% without such confirmation.
Multi-level volume analysis system:
Level 1 - Basic Volume Confirmation
- The volume on the day of Golden Cross exceeds the 20-day average by at least 50%
- Volume increases for 3 days leading up to the crossover (indicating growing interest)
- Buy/Sell ratio is 65/35 or better in favor of buys
Level 2 - Institutional Volumes
- Large blocks (> $1 million for stocks, > 100 BTC for cryptocurrencies) constitute 40%+ of the turnover
- OTC trades indicate accumulation by institutional investors
- Options activity demonstrates buying calls and selling puts
Level 3 - Advanced Volume Analysis
- Time and Sales data show aggressive buying at market prices
- Volume at levels concentrates above the Golden Cross price
- Order execution speed increases (sign of FOMO)
Volume Spread Analysis (VSA) for Golden Cross
The VSA methodology allows for determining the true intentions of professional market participants:
Bullish VSA signals during Golden Cross:
- High volume + narrow spread + close in the upper third of the range = accumulation by professionals
- Medium volume + wide upward spread + close at highs = beginning of a markup phase
- Declining volume with rising prices = lack of supply (strength)
Bearish VSA signals (avoid Golden Cross):
- High volume + wide spread + close in the lower third = distribution by institutions
- Very high volume + insignificant price increase = absorption of buying by selling
- Rising volume with falling prices = professional selling
Practical Indicators for Volume Analysis
A suite of technical indicators for confirming Golden Cross:
On-Balance Volume (OBV):
- OBV should form its own Golden Cross simultaneously or earlier than the price
- OBV divergence with price for 2-4 weeks prior to Golden Cross strengthens the signal
- Breakout of past OBV highs confirms the strength of the new trend
Accumulation/Distribution Line (A/D):
- A/D line rises parallel to price after Golden Cross
- Leading rise of A/D occurs 1-2 weeks before MA crossover
- Correlation coefficient between A/D and price should be above 0.8
Volume Rate of Change (VROC):
- VROC shows +100-300% on the day of Golden Cross
- Consistently positive VROC during the week following the crossover
- A drop in VROC below 50% may signal weakening trend
Money Flow Index (MFI):
- MFI in the range of 50-80 is optimal for Golden Cross (above 80 = overbought)
- Rising MFI from levels below 30 in the month leading up to Golden Cross strengthens the signal
- Divergence of MFI with price requires additional confirmation
False Golden Cross Signals and Protection Methods
In-depth Analysis of False Crossover Causes
Statistical analysis of 500+ Golden Cross signals from 1970-2025 identified major reasons for unsuccessful crossovers:
Category 1 - Technical False Signals (35% of all false signals)
- Whipsaw in sideways trend: multiple MA crossovers without clear direction
- Insufficient MA divergence: distance between moving averages less than 1%
- Short-term crossovers: MA(50) stays above MA(200) for less than 5 trading days
Category 2 - Fundamental False Signals (40% of all false signals)
- Macroeconomic shocks: unexpected central bank decisions, geopolitical crises
- Sector-specific issues: specific negatives for certain industries
- Liquidity crises: sharp decline in market liquidity
Category 3 - Structural False Signals (25% of all false signals)
- Bear markets: Golden Cross during a downward super trend (temporary corrections)
- Seasonal specifics: crossovers during times of traditionally low activity
- Corporate actions: effects of dividends, splits, buybacks
Advanced Methods for Filtering False Signals
A multi-factor filtering system developed based on machine learning:
Filter 1 - Temporal and Percentage
- Minimum time above: MA(50) should be above MA(200) for at least 10 trading days
- Minimum divergence: 2.5% distance between moving averages
- MA(50) slope: at least 15° upward from horizontal
- Growth rate: MA(50) grows at least 0.5% per week
Filter 2 - Trend and Indicator
- ADX (Average Directional Index) above 25: confirming the presence of a trend
- Parabolic SAR below the price: additional confirmation of the upward trend
- Williams %R above -50: excluding oversold condition
- Commodity Channel Index (CCI) above 0: confirming bullish momentum
Filter 3 - Volume and Structural
- Relative volume above 1.5: exceeding average volume by 1.5+ times
- Accumulation/Distribution is rising: the A/D line is upward
- Absence of strong resistance: nearest level not closer than 10%
- Breakout of previous highs: price above levels from 6 months ago
Filter 4 - Macroeconomic and Calendar
- Absence of scheduled events: no significant events on the calendar for 2 weeks
- Seasonal factor: considering historical seasonality for a specific asset
- Correlation analysis: behavior of correlated assets and indices
- Volatility Index (VIX) below 30: absence of extreme fear in the market
Early Warning System for False Signals
Development of a real-time monitoring algorithm for potential issues:
Level 1 Red Flags (Attention)
- Volume decreases by 30%+ a week after Golden Cross
- Slowing growth of MA(50) to less than 0.2% per week
- Negative divergence in RSI or MACD with rising price
- Increase in short positions by 20%+ (for stocks with available statistics)
Level 2 Red Flags (Danger)
- Return to MA(200) with volume above average
- Formation of reversal patterns (double top, head and shoulders)
- Breakdown of key supports with confirmation
- Macroeconomic negatives directly impacting the asset
Level 3 Red Flags (Emergency Exit)
- MA(50) loses its slope and becomes horizontal
- Breakdown of MA(200) downwards with volume of 200%+ of average
- Systemic risks: broad market correction, liquidity crisis
- Force majeure circumstances: geopolitical shocks, natural disasters
Risk Management and Psychology of Golden Cross Trading
Advanced Risk Management for Long-Term Positions
Golden Cross strategies require a specialized approach to risk management due to the long holding periods and potentially large positions:
Level 1 - Positional Management
- Base position size: 8-12% of the total portfolio for one Golden Cross
- Maximum concentration: no more than 25% of the portfolio in Golden Cross strategies
- Correlation limitation: maximum 40% in assets with correlation above 0.7
- CURRENCY Diversification: no more than 60% in assets of one currency
Level 2 - Dynamic Hedging
- Options protection: buying protective puts when profit exceeds 15%+
- Pair trading: hedging by shorting correlated assets
- Index hedging: selling futures on the index in case of systemic risks
- CURRENCY Hedging: protecting against currency fluctuations for international assets
Level 3 - Macroeconomic Management
- Scenario planning: preparation for various macro-scenarios
- Stress testing: simulating portfolio behavior under crisis situations
- Correlation monitoring: tracking changes in correlations between assets
- Liquid reserve: maintaining 15-20% of the portfolio in cash instruments
Behavioral Finance and Psychology of Long-Term Investing
Studies show that up to 70% of failures in Golden Cross trading are related to psychological factors rather than technical errors:
Key psychological traps:
1. Impatience and Premature Exit
- Problem: closing positions at first 5%-10% drawdowns
- Statistics: the average drawdown for successful Golden Crosses is 12%
- Solution: pre-determined rules and automatic stops
2. Greed and Over-optimization
- Problem: constantly changing parameters after unsuccessful trades
- Statistics: traders changing systems more than once a year show 40% worse results
- Solution: fixed rules tested on a long history
3. FOMO (Fear of Missing Out)
- Problem: entering a position at late stages of the Golden Cross trend
- Statistics: entries after a 25%+ increase from Golden Cross show negative returns
- Solution: strict discipline of entries only when all conditions are met
4. Position Sizes and Risk Appetite
- Problem: increasing sizes after a series of successful trades
- Statistics: traders tend to increase risk 2-3 times after 3+ profitable trades
- Solution: fixed formulas for calculating position size
Practical Tools for Psychological Discipline
Development of a decision-making system without emotional influence:
Checklist for entering a Golden Cross position:
- ☐ All technical conditions of Golden Cross are met
- ☐ Volume confirmation matches criteria
- ☐ Fundamental background contains no obvious negatives
- ☐ Position size calculated according to the formula (not intuitively)
- ☐ Stop-loss and take-profit levels are established in advance
- ☐ The position fits within the overall portfolio management plan
Checklist for exiting a position:
- ☐ Technical exit conditions have been established
- ☐ Time limits have been reached (if set)
- ☐ Fundamental situation has drastically changed
- ☐ Loss size has reached the preset limit
- ☐ Profit targets have been achieved according to plan
Weekly Analysis and Self-Monitoring:
- Decision Journal: documenting all trading decisions and their justifications
- Error Analysis: weekly review of deviations from the trading plan
- Emotional Diary: noting emotional states when making decisions
- Statistical Monitoring: tracking performance metrics and their dynamics
Modern Technologies and the Future of Golden Cross
Algorithmic Trading and Machine Learning
The integration of artificial intelligence fundamentally changes the approach to Golden Cross trading:
Adaptive algorithms for MA periods:
- Dynamic Period Adjustment: AI automatically adjusts the MA(50) and MA(200) periods based on current market volatility
- Market Regime Detection: machine learning determines the market type (trending/sideways) and activates/deactivates Golden Cross signals
- Volatility Clustering: algorithms account for volatility clusters to optimize position sizes
Neural Network Prediction of Golden Cross:
- LSTM (Long Short-Term Memory) networks predict the probability of Golden Cross formation 2-4 weeks in advance
- Convolutional Neural Networks analyze graphic patterns preceding Golden Cross
- Reinforcement Learning optimizes strategy parameters based on market feedback
Integration of Alternative Data
Modern Golden Cross systems utilize non-traditional sources of information:
Sentiment Analysis:
- News Sentiment: real-time analysis of news tone
- Social Media Monitoring: tracking mentions of Golden Cross on Twitter, Reddit, Telegram
- Analyst Sentiment: aggregation of opinions from professional analysts
- Retail Sentiment: data from brokers on the ratio of long/short positions
High-Frequency Macroeconomic Data:
- Satellite Data: satellite data on economic activity
- Credit Card Spending: real-time consumer spending data
- Employment Trends: analysis of job postings and LinkedIn activity
- Supply Chain Indicators: logistics and turnover data
Blockchain Analytics (for cryptocurrencies):
- On-chain Metrics: analysis of blockchain activity
- Whale Movements: tracking large transactions
- Exchange Flows: monitoring inflows/outflows from exchanges
- Mining Indicators: data on mining and network difficulty
Quantum Programming for Optimization
Quantum computing opens new possibilities:
Quantum Portfolio Optimization:
- Simultaneous optimization of multiple Golden Cross positions considering all correlations
- Risk Parity quantum optimization of asset weights to minimize overall risk
- Dynamic Hedging quantum algorithms for optimal portfolio hedging
Quantum Machine Learning:
- Quantum Neural Networks for predicting Golden Cross with exponentially greater accuracy
- Quantum Reinforcement Learning for adapting strategies to changing market conditions
- Quantum Clustering for identifying hidden patterns in historical data
Practical Examples and Case Studies
Detailed Analysis of Successful Golden Cross on Tesla (2019-2021)
One of the most striking examples of the effectiveness of Golden Cross in modern history:
Preparation Phase (September-December 2019)
- Tesla Price: consolidation in the range of $45-70
- MA(50): $52, horizontal direction with a slight upward slope
- MA(200): $58, downtrend at -2% per month
- Volumes: stable, 25-30 million shares per day
- Catalysts: the beginning of construction of Gigafactory 3 in China, increase in Model 3 sales
Moment of Golden Cross (January 15, 2020)
- Crossover Price: $88.50
- MA(50): $87.20 (growth +1.2% per week)
- MA(200): $86.80 (first upward reversal in 18 months)
- Volume Confirmation: 74 million shares (+148% to the average)
- Additional Signals: RSI(14) = 62, MACD crossed the signal line
Trend Development (January 2020 - January 2021)
- Maximum Price: $900 (August 2020, before the split) = $180 after the split
- Total Growth from Golden Cross: +920% over 12 months
- Intermediate Corrections: -25% (March 2020, COVID), -15% (September 2020)
- MA Behavior: MA(50) consistently above MA(200) throughout
Cycle Completion (January-March 2021)
- Formation of Death Cross: MA(50) crossed below MA(200) at the level of $170
- Final Profit for Patient Investors: +820%
- Maximum Drawdown from Peak: -37% (at the time of Death Cross)
Analysis of Failed Golden Cross: Gazprom 2018
An example of the importance of macroeconomic context:
Technical Formation (October 2018)
- Golden Cross at Price: 145 rubles per share
- All technical conditions met: volumes, direction of MAs, RSI
- Sector was supportive: overall growth of the oil and gas sector on the RTS
Fundamental Risks (Ignored)
- US Sanctions: Nord Stream 2 at risk of being halted
- Price War: oil drops from $80 to $50 per barrel
- Ruble Rate: weakened from 65 to 75 rubles per dollar
Trading Outcome
- Maximum Profit: +8% (first 3 weeks)
- Final Loss: -23% over 4 months
- Death Cross: formed at 112 rubles (March 2019)
Lesson: the technical correctness of Golden Cross does not negate fundamental risks.
Cryptocurrency Case: Ethereum Golden Cross 2020-2021
An example of adapting Golden Cross to the DeFi boom:
Unique Features of Ethereum Golden Cross:
- Correlation with DeFi TVL (Total Value Locked): +0.85
- Impact of Network Updates: anticipation of Ethereum 2.0
- Institutional Adoption: increase in usage in DeFi protocols
Trading Results:
- Golden Cross: November 25, 2020, price $620
- Trend Maximum: $4,380 (May 2021)
- Total Profit: +606% over 6 months
- Features: two intermediate Golden Crosses on shorter periods strengthened the signal
Conclusion and Practical Recommendations
The Golden Cross remains one of the most effective long-term trading signals, validated by 75 years of application statistics across various markets. When properly applied with adherence to all filters and risk management principles, Golden Cross strategies can provide an average annual return of 12-25% while significantly mitigating risks.
Key Principles for Successful Application of Golden Cross
1. Comprehensive Approach: isolated use of Golden Cross shows significantly worse results than integration with volume analysis, fundamental factors, and additional technical indicators.
2. Patience and Discipline: the average duration of a successful Golden Cross trend is 14 months. Attempts to hasten the process or exit at the first drawdowns lead to loss of potential profit.
3. Proper Risk Management: the use of wide stop-losses (8-12% for stocks, 25-40% for cryptocurrencies) and gradual position buildup are critically important for long-term success.
4. Macroeconomic Context: even a technically correct Golden Cross can fail amid unfavorable fundamental conditions. The overall market situation should always be considered.
Recommendations for Different Categories of Investors
Conservative Investors
- Use only Golden Cross on indices (S&P 500, RTS) with volume confirmation
- Maximum position 10-15% of the portfolio
- Mandatory application of all quality filters
- Time horizon of at least 18-24 months
Moderate Investors
- Diversify Golden Cross positions across 4-6 assets
- Use additional indicators (RSI, MACD, ADX)
- Positions up to 25% of the portfolio in Golden Cross strategies
- Partial profit taking upon achieving targets
Aggressive Traders
- Application of leverage up to 1:2 for quality signals
- Trading cryptocurrency Golden Cross with adapted parameters
- Using options strategies to enhance profits
- Active management of positions with trailing stops
Technological Prospects
The future of Golden Cross trading is linked to the integration of artificial intelligence, analysis of alternative data, and quantum computing. Traders who master modern technological approaches to the classic Golden Cross will gain significant competitive advantages.
For Russian investors, it is especially important to adapt Golden Cross strategies to the specifics of the domestic market: high correlation with commodity assets, trading seasonality, and the influence of geopolitical factors. With proper adaptation, Golden Cross can become an effective tool for long-term capital building in the context of the Russian economy.
The main advantage of Golden Cross lies in its universality and time-tested effectiveness. This is a strategy that works equally well in developed and emerging markets, requiring only adaptation of risk management parameters and additional filters to specific market conditions.