The Buffett Indicator Hits Record Levels: A Sign of Overheating in the U.S. Stock Market
The American stock market is demonstrating unprecedented valuation on a macro scale. The so-called Buffett Indicator – the ratio of the total market capitalization of U.S. stocks to the country's GDP – continues to break historical records. Its current value exceeds historical norms by more than two standard deviations, indicating extreme market overvaluation. This indicator has long surpassed levels observed during the dot-com bubble of the late 1990s and before the 2008 financial crisis, serving as a warning signal of a potential stock market bubble.
What is the Buffett Indicator and what does it signal?
The Buffett Indicator (Buffett Indicator) is a measure that compares the total value of the U.S. stock market to the size of the economy. In simple terms, it is calculated as the ratio of the market capitalization of all U.S. stocks to gross domestic product (GDP). The indicator received its name from the legendary investor Warren Buffett, who referred to this ratio as "the best single measure of where valuations stand at any given moment" and used it to assess market overheatedness or undervaluation on a macro level.
The principle underlying the indicator is straightforward: if the total value of stocks is growing much faster than the economy (GDP), it may indicate the formation of a financial bubble. Historically, GDP grows relatively smoothly, reflecting real economic growth, while the stock market is more volatile and conveys investor expectations regarding future profits. When market value significantly outpaces real economic output, there arises a risk that investors are pricing in overly optimistic growth scenarios – a situation that often precedes substantial price corrections.
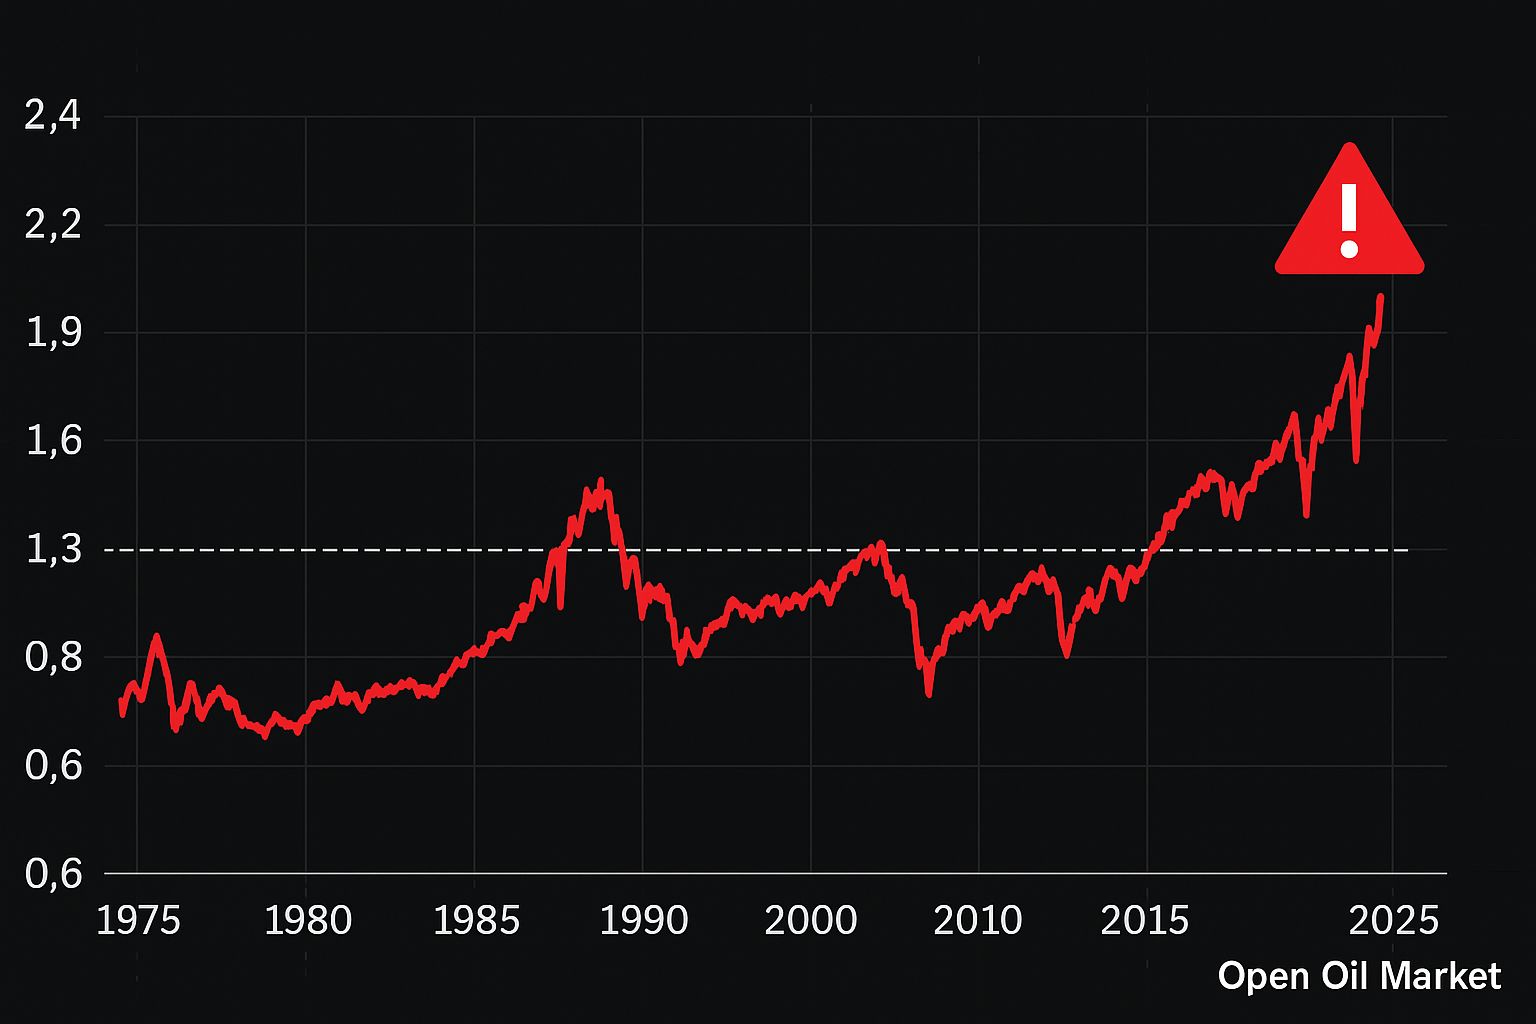
Record Levels: Surpassing the Dot-Com Bubble and the 2008 Crisis
Currently, the Buffett Indicator is at an all-time high. According to recent estimates, the total capitalization of the U.S. stock market exceeds the annual GDP by more than double. In other words, the ratio has surpassed 200%. In comparison, during the peak of the dot-com bubble (2000), it stood at around 130–140%, and prior to the 2008 crisis, it was approximately 100%. Analytical models indicate that the current value of the indicator exceeds its long-term trend by more than 2 standard deviations – an unprecedented deviation from the norm.
Warren Buffett warned back in 2001 that approaching this ratio at 200% signals dangerous market overheating. Today, the indicator has already surpassed this benchmark. Its current record level raises legitimate questions: how justified are such high valuations and are we witnessing the inflation of a new bubble before our eyes?
Historical Precedents: When the Market Overheated
In the past, extreme values of the Buffett Indicator have almost always preceded major upheavals in the stock market. During the height of the dot-com bubble in 1999–2000, the indicator rose to approximately 140%, followed by a collapse of tech stocks and a large bear market that brought the ratio back to a more sustainable level. Similarly, prior to the 2008 crisis, the indicator exceeded 100%, reflecting overheating largely due to the housing bubble; the subsequent financial crash sharply reduced market capitalization relative to GDP.
Even in more recent history, the trend holds. By late 2021, the market-to-GDP ratio reached approximately 170% amidst a post-pandemic rally, only for the market to experience a significant correction in 2022 (indices fell by more than 20%). Although that drop temporarily cooled investor appetites, stock prices subsequently recovered and surged even higher, establishing the current unprecedented level of the indicator.
The lesson from history is clear: when market valuations diverge significantly from the real economy, a pullback is inevitable, whether sooner or later. A high value of the Buffett Indicator does not, in itself, trigger a crisis, but it reflects conditions under which the market becomes vulnerable to external shocks and shifts in sentiment. Such imbalances rarely dissipate without some discomfort.
Why the Market Continues to Rise: Supporting Factors
Despite the alarming signals of overvaluation, the U.S. stock market shows no signs of collapsing just yet. Several factors help explain why the current situation may persist longer than pessimists expect:
- Sustainable corporate earnings. Many corporations are demonstrating revenue and profit growth, often exceeding forecasts. These results support high stock prices and partially justify elevated multiples.
- Stable macro conditions. Inflation, which surged at the start of the decade, has moderated to a more manageable level by 2024. The Federal Reserve has paused interest rate hikes, and expectations of rate cuts make stocks more attractive compared to bonds.
- Globalization of business. Large U.S. companies derive a significant portion of their revenues from outside the U.S. Thus, market capitalization relative to U.S. GDP appears overstated – as it compares a global business to a local economic metric.
- Technological boom. Breakthroughs in IT (such as the development of artificial intelligence) fuel investor confidence in accelerated economic growth in the future. Today’s valuations of tech companies are partly justified by the fact that, unlike during the dot-com era, these businesses are already generating substantial profits and cash flows.
Collectively, these factors create a foundation for the overvalued market to remain afloat for an extended period. Many participants believe that “this time might be different,” and traditional metrics like the Buffett Indicator should be viewed in the context of new realities.
Expert Opinions: The Metric Isn’t Perfect, but the Signal is Alarmingly Real
Many analysts acknowledge the usefulness of the Buffett Indicator for assessing the overall situation, but emphasize that it is just one tool, and it is not perfect. A high value of the indicator should prompt increased vigilance but should not be seen as an immediate “trigger” for a stock sell-off. Experts note that the market can remain overvalued for an extended period, as the famous saying goes, “the market can remain irrational longer than you can remain solvent.” In other words, even when a bubble is detected, predicting the moment it will burst is nearly impossible.
There are also limitations of the Buffett Indicator that reduce its definitiveness:
- Interest Rates and Liquidity. The market-to-GDP ratio does not account for the level of interest rates. Low borrowing costs can support higher stock valuations: in a low-interest environment, the market is naturally traded with a larger capitalization relative to GDP.
- Global Revenues of Companies. The ratio only considers the U.S. GDP in the denominator, while larger businesses generate revenue globally. A significant portion of American corporations' revenue is generated abroad, which may exaggerate overvaluation by comparing a global market to a local economy.
- Structural Changes in the Economy. The modern economy has changed compared to the past: digitalization, new business models, and other shifts may have raised the “normal” level of the indicator. For example, record profitability of tech giants partly explains the higher market-to-GDP ratio today compared to the past.
Given these factors, market professionals advise against relying solely on one indicator. It is far more effective to form an opinion about the state of the market based on a comprehensive set of metrics – from profitability ratios (P/E, CAPE) to debt indicators, margins, interest rate dynamics, and more. Paying attention to the “mosaic” of data provides a more rounded picture, while any single metric, even one as authoritative as the Buffett Indicator, cannot capture all nuances.
The Role of Politics: Trump’s Position and Government Intervention
Market dynamics are influenced not only by economic indicators but also by political factors. In 2025, investors' attention is focused on the actions of the Donald Trump administration. In an effort to sustain the market rally, Trump initiates policies to stimulate the economy – specifically, pushing for new tax breaks for businesses. Recently, his tax package passed through the Senate by a narrow majority, signaling the government’s readiness to support the corporate sector and the stock market.
The president himself asserts that he will not allow the stock market to crash. This rhetoric creates a sense among many that the government will intervene in all available ways (through tax stimuli, regulatory relaxation, pressure on the Federal Reserve) in the face of perceived market risks. Such promises only enhance investors' sense of "insurance."
Ultimately, the prospect of additional stimuli and the friendly rhetoric from the White House instill confidence in investors: at the first signs of trouble, authorities are poised to take emergency measures. This supports the inclination to remain in stocks despite clear signs of overheating.
Bubble or New Normal? Conclusions
The Buffett Indicator, having reached unimaginable heights, undeniably sends a warning to the market. In the past, such a strong divergence between stock prices and economic reality has consistently ended in a pullback – the only question was about timing and triggers. Today's situation is unique: while there are signs of a bubble (record ratios, excitement surrounding specific sectors), there are also factors that were not present before – the unprecedented role of technology, the global nature of markets, and proactive government policies aimed at preventing crises.
Whether the current extreme overvaluation will be quickly corrected by a crash or whether high multiples will become the “new normal” for the coming years is a question with no definitive answer. The U.S. stock market is balancing between euphoria and risks. History teaches that periods of rapid ascent often end painfully; however, the boiling point becomes clear only retrospectively. In light of the record Buffett Indicator, it is wise to maintain healthy skepticism and carefully weigh each step in the market. Seasoned strategists warn that now is not the time for reckless risks – one should enjoy the growth only with a securely fastened “seatbelt.”


